Visualising Data with JavaScript: Getting Started
Requires previous programming experience, not necessarily JavaScript
21 June 2019
The web is a fantastic place to visualise data because charts can be published and shared easily, and the tools for creating charts are powerful, expressive and usually free.
The programming language built into practically all web browsers is JavaScript. This is a relatively easy language to learn and it has a large number of libraries that allow you to visualise data.
This tutorial serves as an introduction to visualising data using JavaScript and is designed to get you up and running with your first chart.
You'll create a simple chart with one of the most popular JavaScript charting libraries Chart.js. No prior JavaScript experience is required, but previous coding experience will be useful. (This isn't a JavaScript tutorial, there's plenty of them already.)
You'll use one of two approaches:
- CodePen (a simple to use coding platform)
- local development (coding on your own computer)
The first approach is a lot simpler. If you'd rather avoid creating files on your computer, getting a text editor set up etc. then I recommend using CodePen.
On the other hand, developing locally is typically the approach experienced coders use. It gives you more control and is more suitable for larger projects, but it can be fiddly getting started.
You ready to get started? Let's go!
Your first chart (using Codepen)
Start by navigating to CodePen at https://codepen.io.
Create a new pen. (At the time of writing, you click 'Start Coding' to create a new pen.)

You should see something like:
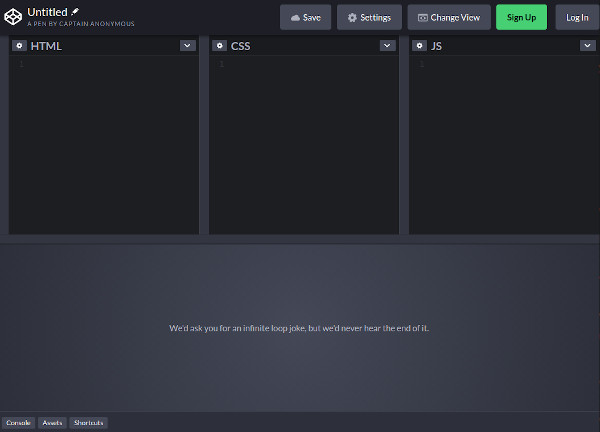
CodePen's interface consists of four panels: HTML, CSS, JS and an output panel. The first three panels are used to create your webpage:
- HTML represents the content of your page. Any text, images and other content will be added to the HTML.
- CSS is used for styling the content (such as colours and font sizes)
- JavaScript (or JS) is a programming language that can manipulate the webpage (such as adding or removing HTML) and handle user interaction.
Before starting coding, click 'Change View' and select the arrangement with the output window on the right:
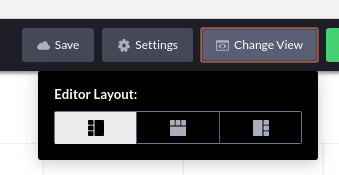
This arrangement will suit your chart better.
Now let's code!
HTML
Add the following to the HTML panel:
<h3>My chart</h3>The <h3> is known as a tag and tells the browser that the text between <h3> and </h3> should be displayed as a title.
We'll now add a tag that'll contain our chart:
<canvas id="myChart"></canvas>The <canvas> tag is an HTML element that allows shapes (such as circles, rectangles and lines) to be drawn in a webpage.
JavaScript
Now we'll add some JavaScript to create our first chart.
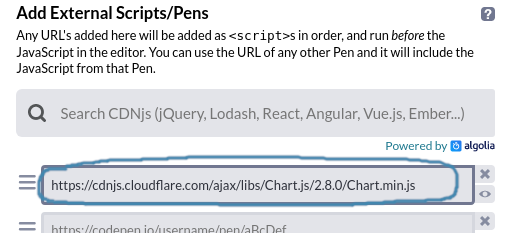
First we have to include the Chart.js library in our webpage. To do this in CodePen click on the cog to the left of the JS title:
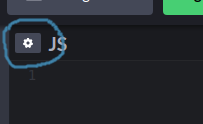
Add the URL https://cdnjs.cloudflare.com/ajax/libs/Chart.js/2.8.0/Chart.min.js to the 'Add External Scripts/Pens' list:
Now add the following JavaScript to CodePen's JS panel:
new Chart('myChart', {
type: 'bar',
data: {
labels: ['1980', '1990', '2000', '2010', '2020'],
datasets: [{
data: [12, 15, 14, 16, 18]
}]
},
options: {}
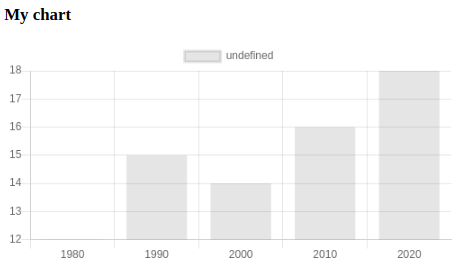
});Soon after adding this code CodePen should refresh the output pane and you should see:
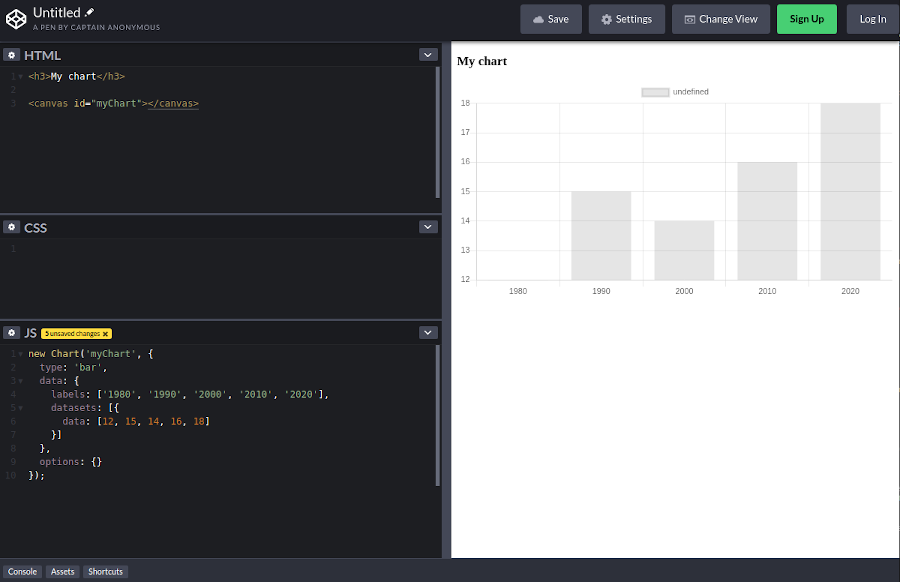
Let's step through the code for creating the chart:
new Chart(...)is the code that creates the chart. (Chartis a constructor function provided by Chart.js that creates the chart.)- the constructor function
Chartaccepts two arguments. The first is the id of thecanvaselement and the second is an object that configures the chart - the configuration object usually consists of three properties:
type,dataandoptions - the
typeproperty is the chart type e.g.bar,line,bubbleetc. - the
dataproperty is an object specifying your data - the
optionsproperty is for setting chart options
If you'd like to know more about how Chart.js charts are configured read my Getting Started with Chart.js tutorial.
You might notice the y-axis doesn't start from zero. This is bad practice as it can distort the true difference between the bar heights. To fix this we can add an option:
new Chart('myChart', {
  ...
  options: {
    scales: {
      yAxes: [{
        ticks: {
          beginAtZero: true
        }
      }]
    }
  }
});
Now the y-axis should start from zero.
(The options object can get a bit verbose, but you get used to it with practice.)
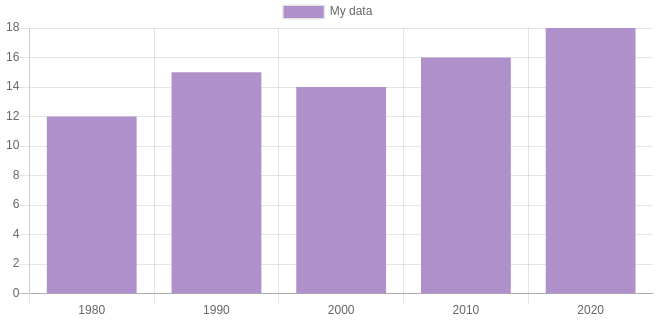
Now set the name and colour of the bars:
new Chart('myChart', {
  ...
  data: {
    ...
    datasets: [{
      label: 'My data',
      backgroundColor: '#af90ca',
      data: [12, 15, 14, 16, 18]
    }]
  },
  ...
});
Your chart should now look like:
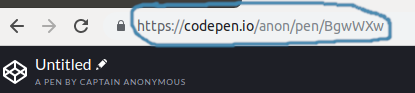
One of the cool things about CodePen is that your chart can be shared with anyone interested in your chart. First save the chart by clicking Save.
(You might be prompted to set up an account if you haven't already. This is optional but I recommend signing up.)
You can then copy the URL and share this with anyone interested.
I recommend that you have a play around with the code. For example, try changing the data values or the colour of the bars. If you're feeling more adventurous explore the other chart types that Chart.js offers.
You can also check out the finished pen here:
See the Pen Simple chart.js bar chart by Peter Cook (@createwithdata) on CodePen.
Your first chart (local development)
The local development approach involves creating and editing text files on your computer and viewing them using your web browser. If you'd like to use your own data to create a chart (for example data exported from one of your spreadsheets) you'll also need to set up a local webserver which usually involves installing software.
Text editor
You'll need a text editor to create and edit your files. I recommend using Atom or Visual Studio Code which are both free, simple to use but powerful. If you're not familiar with either of these I recommend learning how to work with files and directories in Atom (see here) or VS Code (see here).
Create a project folder
Start by creating a project folder. Using the Finder (on Mac) or File Explorer (on Windows) create a folder called MyChart. This might go in your Documents folder if you have one.
Add three subdirectories css, data and js to MyChart.
Now open Atom or VS Code (or the editor of your choice) and open MyChart. You should see your folders in the sidebar:
MyChart/
  css/
  data/
  js/
Now create the following files:
style.cssincssmain.jsinjsindex.htmlinMyChart
Your project folder should look like:
MyChart/
  css/
    style.css
  data/
  js/
    main.js
  index.html
HTML
Open index.html and copy and paste the following:
<!doctype html>
<html lang="en">
<head>
  <meta charset="utf-8">

  <title>My Chart</title>
  <link rel="stylesheet" href="css/style.css">
</head>

<body>
  <h3>My chart</h3>

  <script src="js/main.js"></script>
</body>
</html>
That's quite a lot of code and it may be unfamiliar to you. Most of it is standard and will be found in the vast majority of webpages. The bits you need to be aware of are:
- the
<title>...</title>tag which allows you to set the title of the page. (This is the text that appears in your browser tab.) - the
<link>...</link>tag which tells the browser where to find your CSS filestyle.css - the
<body>...</body>tag which contains the content of your page. In this case we've added a level 3 heading using a<h3>tag - the
<script>...</script>tag which tells the browser where to find your JavaScript filemain.js
Now add an HTML tag (below the line containing <h3>) that'll contain our chart:
<canvas id="myChart"></canvas>The <canvas> tag is an HTML element that allows shapes (such as circles, rectangles and lines) to be drawn in a webpage.
You also need to include Chart.js. Add the following line (above the existing <script> tag):
<script src="https://cdnjs.cloudflare.com/ajax/libs/Chart.js/2.8.0/Chart.min.js"></script>(We're including Chart.js from a content delivery network (cdnjs.com) to keep things simple. Most well known JavaScript libraries can be included in this manner.)
JavaScript
Now add the following to main.js:
new Chart('myChart', {
  type: 'bar',
  data: {
    labels: ['1980', '1990', '2000', '2010', '2020'],
    datasets: [{
      data: [12, 15, 14, 16, 18]
    }]
  },
  options: {}
});
(See the CodePen section above for further explanation of this code. You'll also see how to set the y-axis minimum to zero.)
Save main.js (and index.html if you haven't already).
Now switch to your web browser and use 'Open File' (or similar) to open your index.html file. You should see:
If all's gone well you'll have created a simple webpage containing a Chart.js chart. Try editing some of the data to check that the chart updates accordingly. You can also check out the CodePen section to see how to change the bar title and colour.
You can also start exploring Chart.js's documentation to see what else can be changed. Maybe you can change the chart type?
Wrapping up
We've looked at a couple of approaches to creating a chart with JavaScript. The CodePen approach is great if you're new to JavaScript as it saves a lot of effort in getting software, files and folders set up. If you get more serious about using JavaScript for data visualisation the second approach is recommended especially if your projects become more ambitious.
AI for Data Visualisation shows you how AI can help you explore, transform and visualise your data.
Find out more
Visualising Data with JavaScript teaches you how to build charts and data stories using Chart.js, Leaflet, D3 and React.
Find out more
Data Dashboards with JavaScript teaches you how to build data dashboards using React, Chart.js and Leaflet.
Find out more
Learn the fundamentals of HTML, SVG, CSS and JavaScript for building data visualisations on the web.
Find out more
"One of the best D3 books I've read. The contents are very clear, it is easy to follow and the concepts are very solid."
D3 Start to Finish teaches you how to build a custom, interactive and beautiful data visualisation using the JavaScript library D3.js.
Find out more