D3 Start to Finish book
"One of the best D3 books I've read. The contents are very clear, it is easy to follow and the concepts are very solid."
Javier García Fernández (Journalist & developer)
"I’d very much recommend this book to anyone who needs to rapidly get up to speed with D3, whether they are an experienced developer or a relative novice. It will give you all the tools and knowledge to create professional grade visualisations."
Mike Hadlow (Developer & blogger)
"Being able to master the programmatic building of data visualisations is a treasured capability. Being able to elegantly explain and educate others to help develop their capability is of exceptional value. Peter is a one of those rare talents who flourishes at both: if you want to learn from one of the best, I can’t recommend Peter’s books enough."
Andy Kirk (Visualisation consultant, author, speaker & trainer)
D3 Start to Finish teaches you how to build a custom, interactive and beautiful data visualisation using the JavaScript library D3.js (versions 6 and 7).
The book covers D3 concepts such as selections, joins, data requests, scale functions, event handling and transitions. It also covers general web development techniques such as state management and modularisation. In other words, everything you need to know to build a real world, custom data visualisation.
You'll also learn how to put these concepts into practice by building an interactive data visualisation called Energy Explorer.
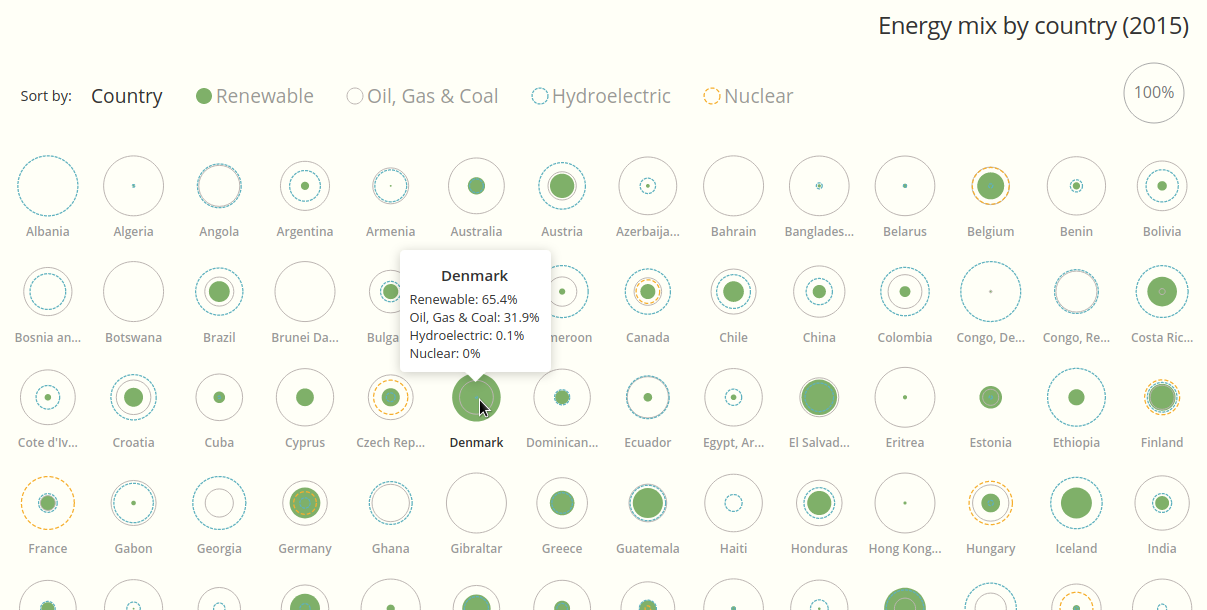
View live version of Energy Explorer
This is a custom data visualisation that visualises the energy mix of 141 countries. There are 15 separate build steps and you're taken through each step in detail. There's also a code download link for all 15 steps so you can follow along.
Some of the topics covered are:
- requesting CSV data using D3
- D3 data joins (including joining nested data)
- architecting a data visualisation using a layout function
- detailed styling using CSS
- adding a popup using Flourish's popup library
- state management
- animations using D3 transitions
- data manipulation using Lodash
- adding a menu, legend and footer
If you've been wanting to learn D3, or already know some D3 but are struggling to put it into practice, this book is ideal.
"This book takes the reader gently through a series of easy-to-follow and easy-to-digest steps. At no point did it feel too daunting and the style is clear and eminently readable. There's always more to learn but, by the end, I felt ready to use D3 for my own project. Highly recommended for those who have not yet tried D3 or are struggling with their first steps."
Berl Steiner (Developer)
Prerequisites
To get the most out of this book you need to be familiar with HTML, SVG, CSS and JavaScript. If you need to get up to speed with these languages I recommend my book Fundamentals of HTML, CSS, SVG & JavaScript for Data Visualisation.
You’ll also need a text editor (such as VS Code or Brackets), a local web server and a web browser. The book contains two appendices that help you get these set up.
To keep things simple build tools such as webpack aren't used. If you'd like to cover ES2015 modules, webpack and other advanced topics have a look at the Advanced Edition package. D3 version 7 is used in this book.
Advanced Edition
The Advanced edition contains additional material including:
- how to transform the raw data from the World Bank into the required format
- how to make Energy Explorer responsive to different device sizes
- how to add dark mode to Energy Explorer
- ES2015 modules and webpack
- how to make Energy Explorer using ES2015 modules and webpack
The Advanced edition is for experienced developers and requires familiarity with Node.js and the command line.