Visualising Data with JavaScript Course
Visualising Data with JavaScript is a video based course that teaches you how to build maps, charts, dashboards and data stories using Chart.js, Leaflet, D3 and React.
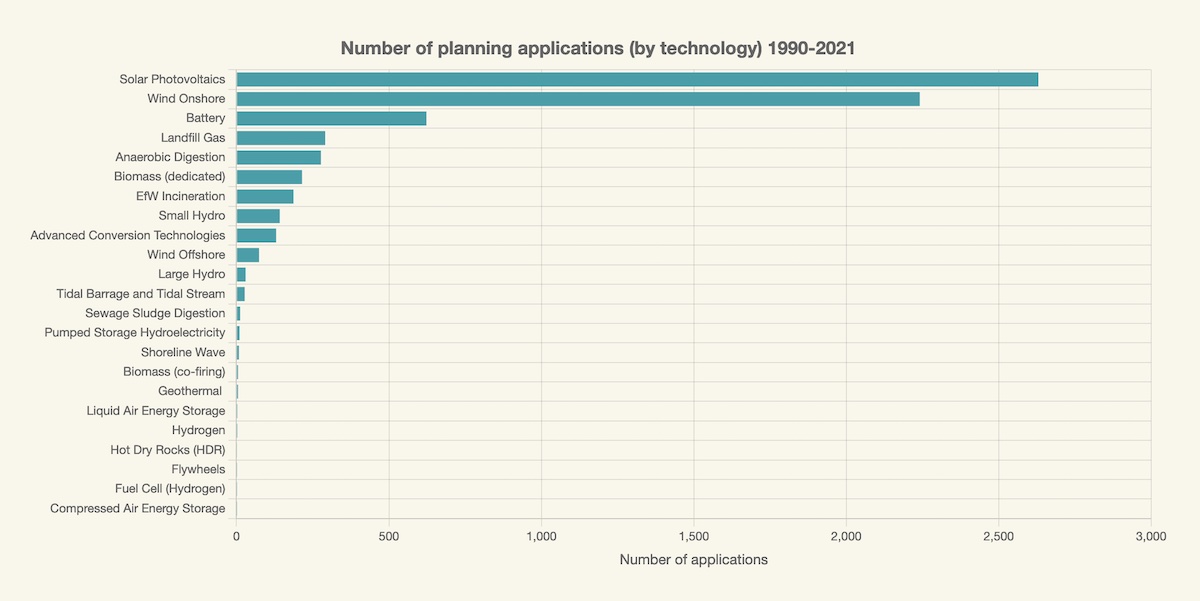
You'll learn how to build charts using Chart.js:
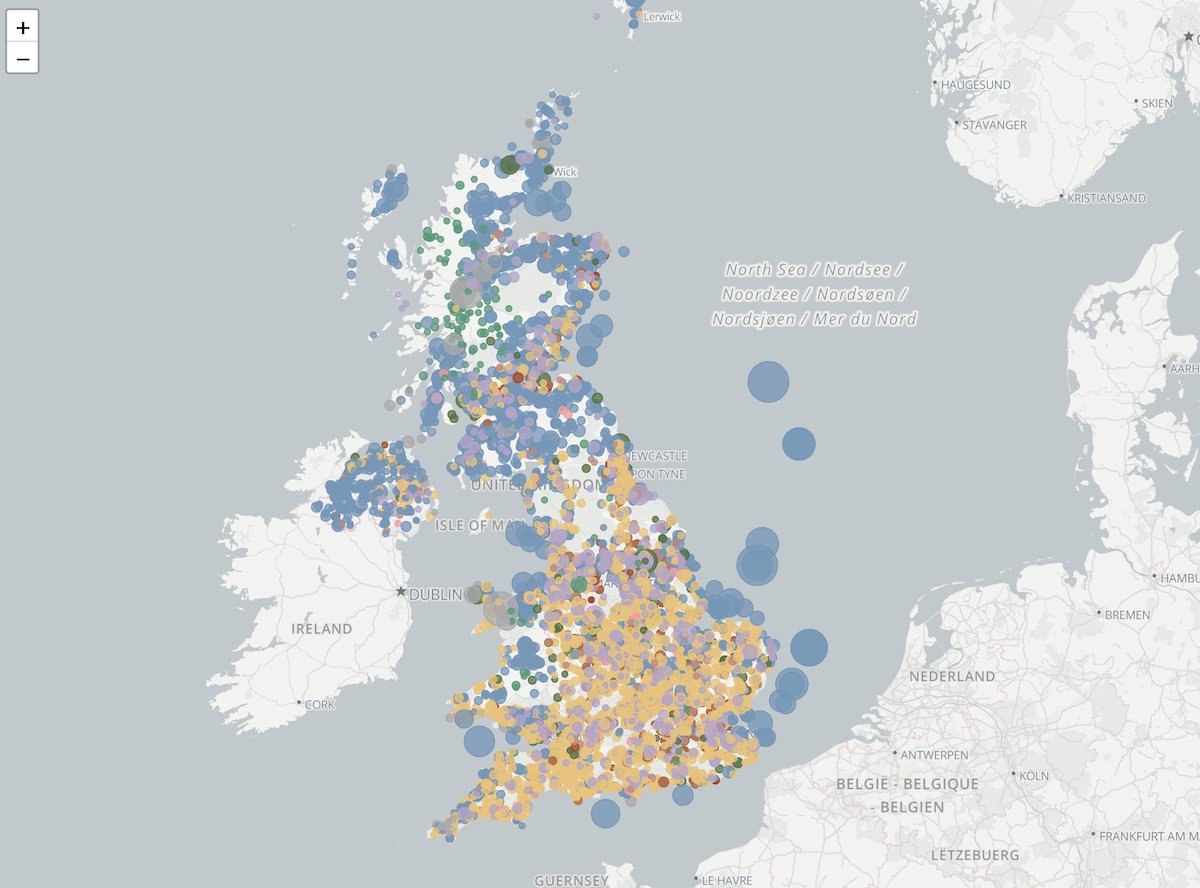
Data-driven maps using Leaflet:
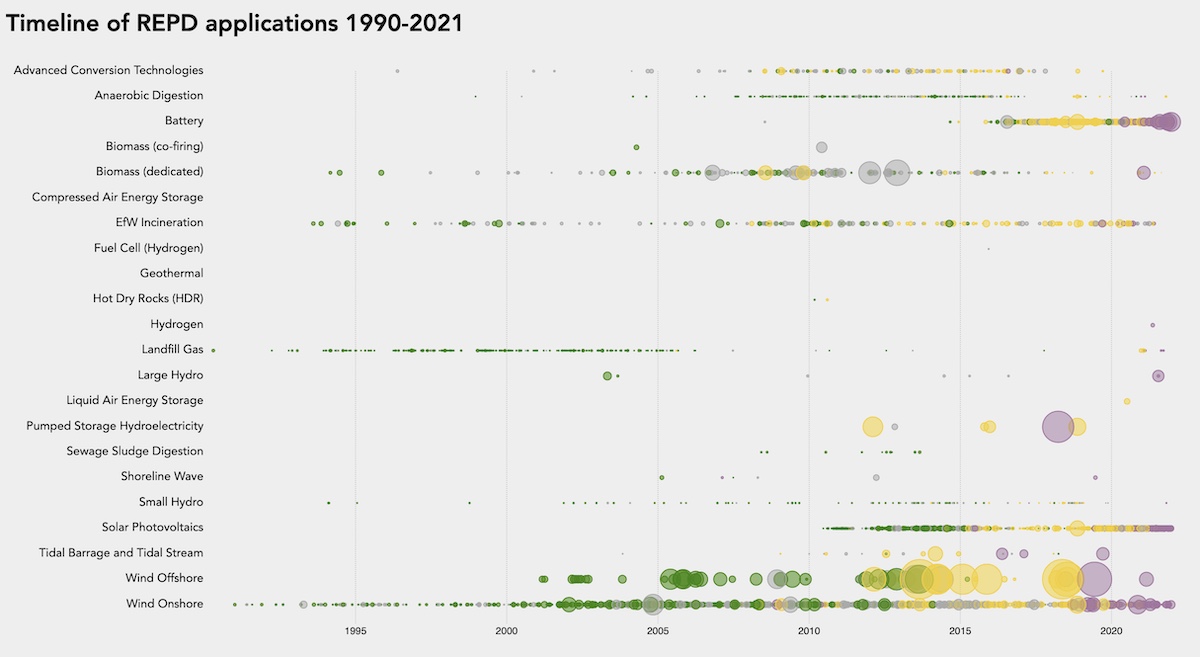
and a custom chart using D3.js:
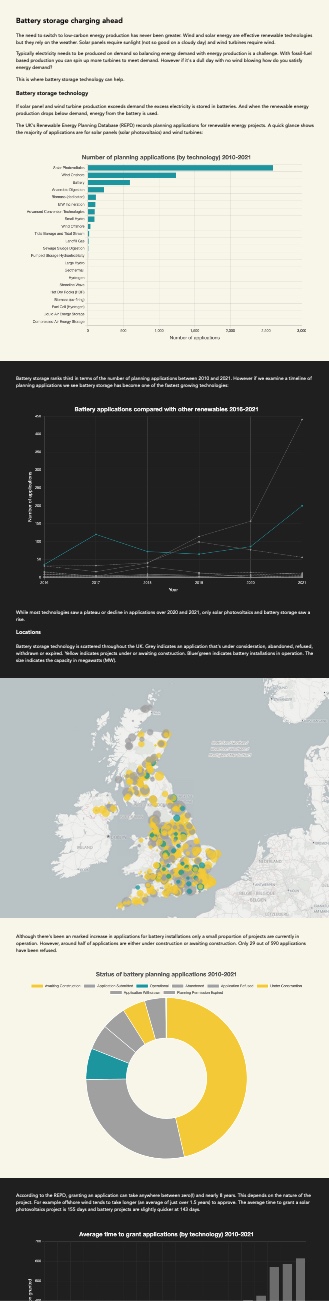
You'll also learn how to make a data story that combine multiple charts and maps.
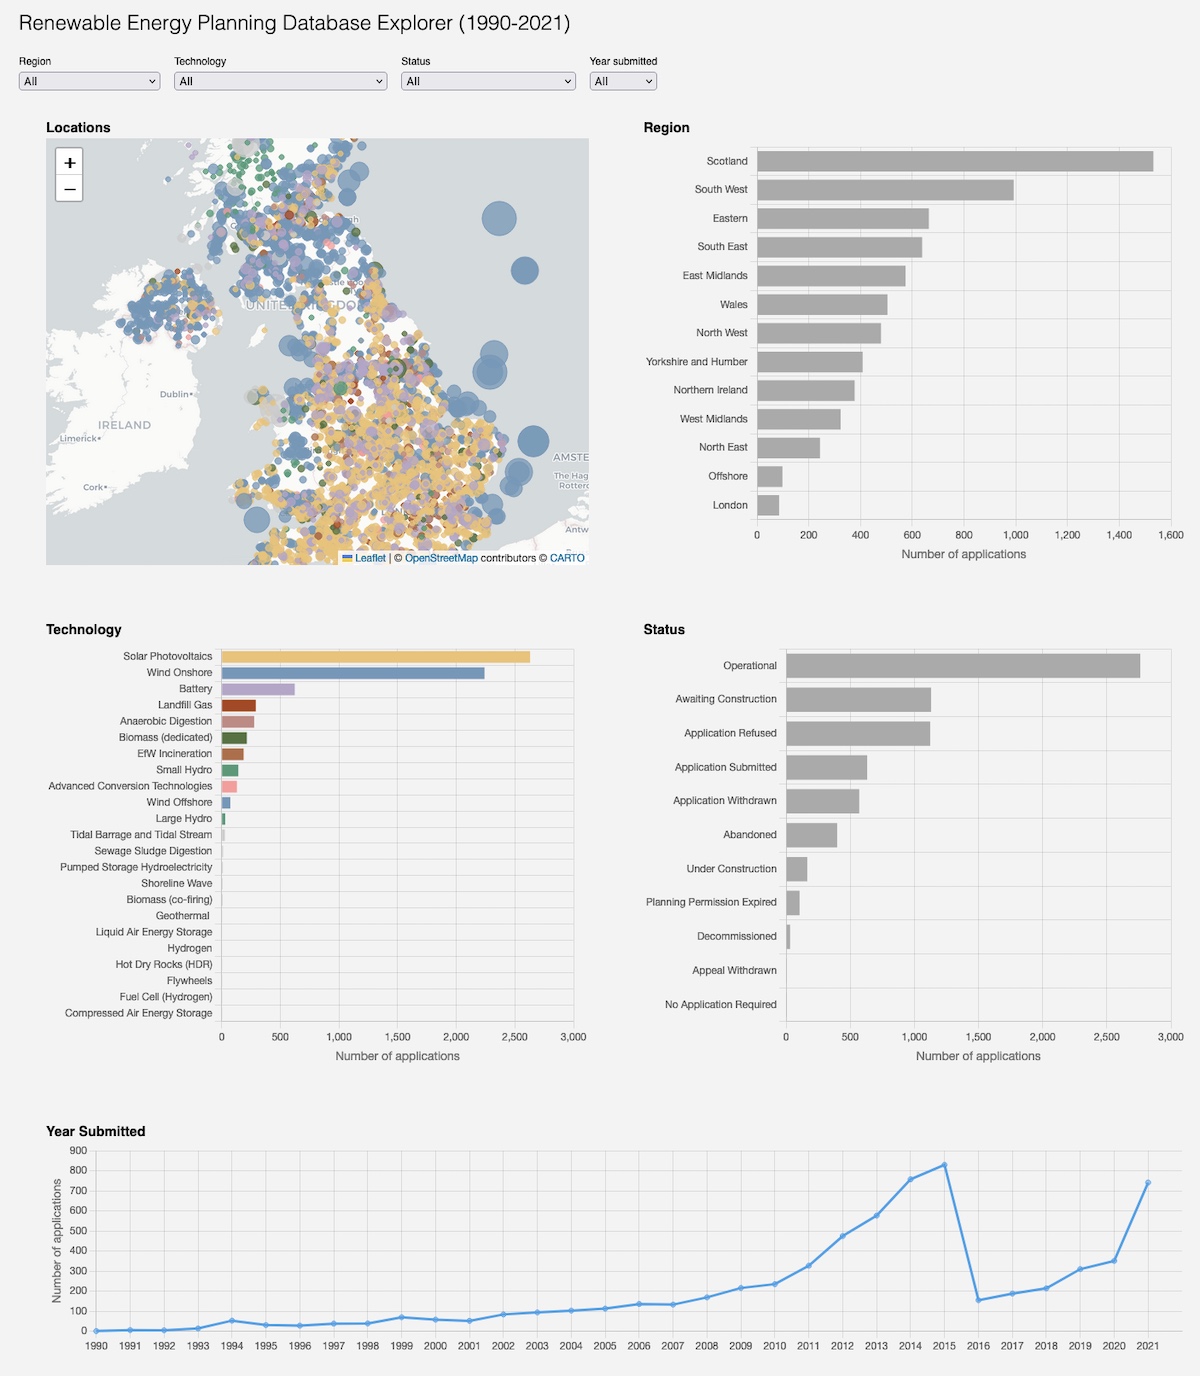
In addition you'll learn how to make a dashboard using Chart.js, Leaflet and React:
This is a complete course that'll show you how to build all of the above. I've spent months figuring out efficient ways to build these maps, charts and dashboards. I'd like to share these techniques with you so that you don't have to figure it out for yourself.
If you've been wanting to create maps, charts, data stories and dashboards for the web this course is ideal.
Who can benefit from this course?
- Web developers who need to implement maps, charts and dashboards.
- Data scientists/analysts who'd like to present their data. You might already be using tools such as Dash (Python), Streamlit (Python), Shiny (R), PowerBI and Tableau.
- Data journalists who wish to present their data in story form.
Why take this course?
This course shows you how to build maps, charts, data stories and dashboards using JavaScript.
You'll learn how to create maps, charts, data stories and dashboards similar to what tools such as Dash, Streamlit, Shiny, PowerBI and Tableau create, but you'll be using free and open-source libraries. You'll also have much more flexibility as to what you can create and hosting costs are likely to be lower too.
Course format
The course is in video format (preview a lesson) and consists of 8 lessons spread over 3 months. In total there's over 2.5 hrs of video content.
The course is hosted on Teachable and students may ask questions via the comments section in each lesson.
Full course notes are also included (as a PDF download) and a copy of my Fundamentals of HTML, SVG, CSS and JavaScript for Data Visualisation eBook is also included to help fill any knowledge gaps.
Course content
The course is made up of eight video lessons spread over three months:
Month 1
| Lesson | Content |
|---|---|
| Data Visualisation and JavaScript | Overview of JavaScript’s role in data visualisation. How to create a web application using the build tool Vite. Walk through an application that loads and displays data. (16 minutes) |
| Make a Chart with Chart.js | Introduction to Chart.js and tidy.js. How to create a chart using Chart.js. How to process data using tidy.js. (15 minutes) Preview this lesson |
| Styling and Customising Chart.js | How to style Chart.js charts. How to create a Chart.js chart with a dark theme. How to create multi-line charts and stacked bar charts from long format data. (11 minutes) |
Month 2
| Lesson | Content |
|---|---|
| Custom Charts with D3.js | Introduction to D3.js (including selections, joins, scale functions and axes). How to add an information popup. Walk through a custom visualisation built using D3.js. (22 minutes) |
| Data-driven Maps with Leaflet | Introduction to Leaflet. Walk through a Leaflet example that displays data points. (8 minutes) |
Month 3
| Lesson | Content |
|---|---|
| Data Stories | How to build a data story using HTML, CSS, JavaScript, Chart.js and Leaflet. How to publish the data story to the web (for free). (15 minutes) |
| Data Dashboards | Introduction to dashboards. Introduction to React. How to build a data dashboard using React, Chart.js and Leaflet. (38 minutes) |
| Client/Server Dashboards | Introduce client/server architecture. How to build an API using Node. How to adapt the dashboard to fetch data from the API. (28 minutes) |
Code projects are included for each lesson. These projects are fully working examples built using JavaScript, Chart.js, Leaflet, D3.js and React.
It also includes over 200 pages of course notes (PDF format) and a copy of my Fundamentals of HTML, SVG, CSS and JavaScript for Data Visualisation eBook.
How much is the course
The course is $39/month. You can enroll at any time and if you don't like the course you can cancel before the end of the course.
The content is released each month, so when you first sign up you receive the first month's content. At the beginning of subsequent months you'll be able to access that month's lessons.
The subscription will continue beyond month 3 so you can still access the content. You can of course cancel once you've finished the course.
You can also pay a one-off $99 for six months access, in which case you'll receive the full content immediately. (However you won't be able to cancel.)
Subscribe to my newsletter for a discount code.There's enough material to fill a three-day workshop. I'd typically charge $750 for a three-day workshop so I think this course offers great value for money.
What will I need to know?
You need to be familiar with HTML, SVG, CSS and JavaScript. If you need to get up to speed with these languages this course also includes my book Fundamentals of HTML, CSS, SVG & JavaScript for Data Visualisation.
Praise for my book D3 Start to Finish
"Being able to master the programmatic building of data visualisations is a treasured capability. Being able to elegantly explain and educate others to help develop their capability is of exceptional value. Peter is a one of those rare talents who flourishes at both: if you want to learn from one of the best, I can’t recommend Peter’s books enough."
Andy Kirk (Visualisation consultant, author, speaker & trainer)
"One of the best D3 books I've read. The contents are very clear, it is easy to follow and the concepts are very solid."
Javier García Fernández (Journalist & developer)
"I’d very much recommend this book to anyone who needs to rapidly get up to speed with D3, whether they are an experienced developer or a relative novice. It will give you all the tools and knowledge to create professional grade visualisations."
Mike Hadlow (Developer & blogger)
"This book takes the reader gently through a series of easy-to-follow and easy-to-digest steps. At no point did it feel too daunting and the style is clear and eminently readable. There's always more to learn but, by the end, I felt ready to use D3 for my own project. Highly recommended for those who have not yet tried D3 or are struggling with their first steps."
Berl Steiner (Developer)