How to make a data-driven map: Part Three
Requires completion of Part Two and basic knowledge of JavaScript, HTML and CSS
26 July 2019
This is Part Three of a four part tutorial on how to make a data-driven map using JavaScript.
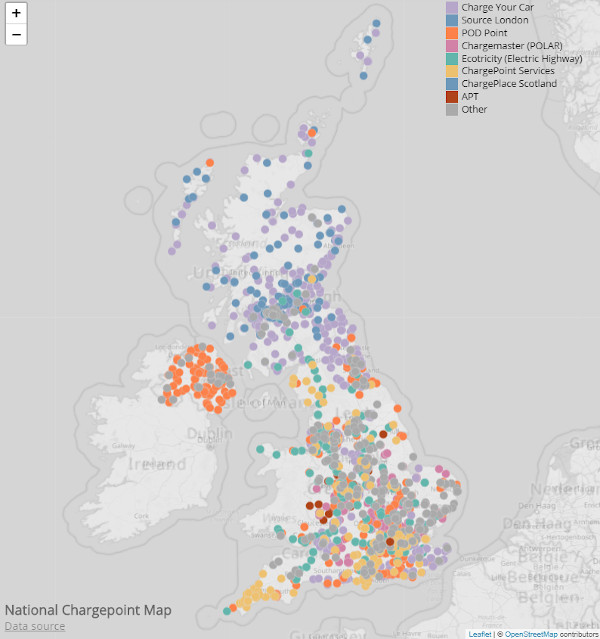
The end result is an web map visualising electric vehicle chargepoint locations:
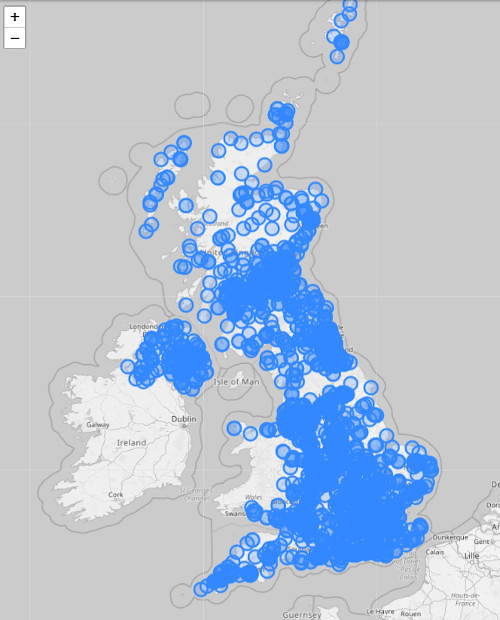
In the previous part we loaded a dataset from the UK's National Chargepoint Registry using D3 and displayed each location on the map:
In this part we'll style the markers in a data-driven fashion. Charging points which are in service will be coloured according to the controller (e.g. Charge Your Car, Source London, Chargemaster) while out of service charging points will be displayed in a semi-transparent grey.
Getting started
Open your work from Part Two (or use Part Two's pen).
Outline
The steps you'll take are:
- refactoring (to make the code more modular)
- add a colour look-up object
- style the 'in service' charging points
- style the 'out of service' charging points
- adjust the basemap opacity to make the markers stand out
Refactoring
We'll start by refactoring the code to make it more modular. We'll create functions for:
- initialising the map
- requesting the data
Add a function for intialising the map
Make the map variable a global by declaring it at the top of the JavaScript:
var data, map;Add a function called initMap() at the top of the file (after the var data, map; declaration) and move the map initialisation code into this function:
function initMap() {
map = L.map('map');
L.tileLayer('https://{s}.tile.openstreetmap.org/{z}/{x}/{y}.png', {
attribution: '© <a href="https://www.openstreetmap.org/copyright">OpenStreetMap</a> contributors'
}).addTo(map);
map.setView([55, -2], 6);
}Make sure you remove the
varfrom beforemap = L.map('map');
Add a call to initMap() at the bottom of the JavaScript:
initMap();The map should re-appear when the initMap() call is added.
Add a function for requesting the CSV
Add a function getData() below the initMap function and move the data request code into it:
function getData() {
  d3.csv('https://s3-us-west-2.amazonaws.com/s.cdpn.io/2814973/charge-points-slim.csv')
    .then(function(csv) {
      data = csv;
      addMarkers();
  });
}
Add a call to getData() at the bottom of the JavaScript:
getData();Your code should now look like:
var data, map;
function initMap() {
map = L.map('map');
L.tileLayer('https://{s}.tile.openstreetmap.org/{z}/{x}/{y}.png', {
attribution: '© <a href="https://www.openstreetmap.org/copyright">OpenStreetMap</a> contributors'
}).addTo(map);
map.setView([55, -2], 6);
}
function getData() {
d3.csv('https://s3-us-west-2.amazonaws.com/s.cdpn.io/2814973/charge-points-slim.csv')
.then(function(csv) {
data = csv;
addMarkers();
});
}
function addMarkers() {
data.forEach(function(d) {
var marker = L.circleMarker([+d.latitude, +d.longitude]);
marker.addTo(map);
})
}
initMap();
getData();Can you see the code has a clearer structure now? There's three functions
initMap(),getData()andaddMarkers()whose names describe what they do.initMap()andgetData()are called at the end whileaddMarkers()is called when the CSV arrives. Modularising your code becomes more important as features are added and the application grows.
Check that your map is still working - you should be able to see the map with the blue circular markers overlaid.
Add a colour key object
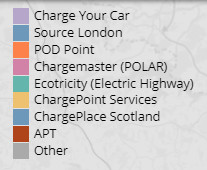
We'll now specify an object that defines colours for the most common controllers (such as Charge Your Car and Source London). Add this near the top of the code, above initMap():
var colorScale = {
  'Charge Your Car': '#B6A6CA',
  'Source London': '#6D98BA',
  'POD Point': '#FC814A',
  'Chargemaster (POLAR)': '#D282A6',
  'Ecotricity (Electric Highway)': '#64B6AC',
  'ChargePoint Services': '#EEC170',
  'ChargePlace Scotland': '#6D98BA',
  'APT': '#AF4319'
};
The colours were chosen by hand. Feel free to change them!
Style the 'in service' charging points
Towards the bottom of your JavaScript is the addMarkers() function which iterates through the data and adds a circleMarker for each charging station.
The markers can be styled using the .setStyle() function. This function accepts an object containing key value pairs.
Common keys include:
| Key | Description | Example values |
|---|---|---|
| radius | Circle radius | 2, 5, 10 |
| fillColor | Circle colour | red, #123 |
| color | Circle's outline colour | red, #123 |
| fillOpacity | Circle opacity | 0, 0.4, 1 |
| weight | Circle's outline thickness | 0, 0.1, 5 |
You can see other options in Leaflet's documentation.
Let's start by changing the radius of the markers. Just before marker.addTo(map) add:
    marker.setStyle({
      radius: 1
    });
Your addMarkers() function should look like:
function addMarkers() {
  data.forEach(function(d) {
    var marker = L.circleMarker([+d.latitude, +d.longitude]);

    marker.setStyle({
      radius: 1
    });

    marker.addTo(map);
  })
}
and the map should now look like:
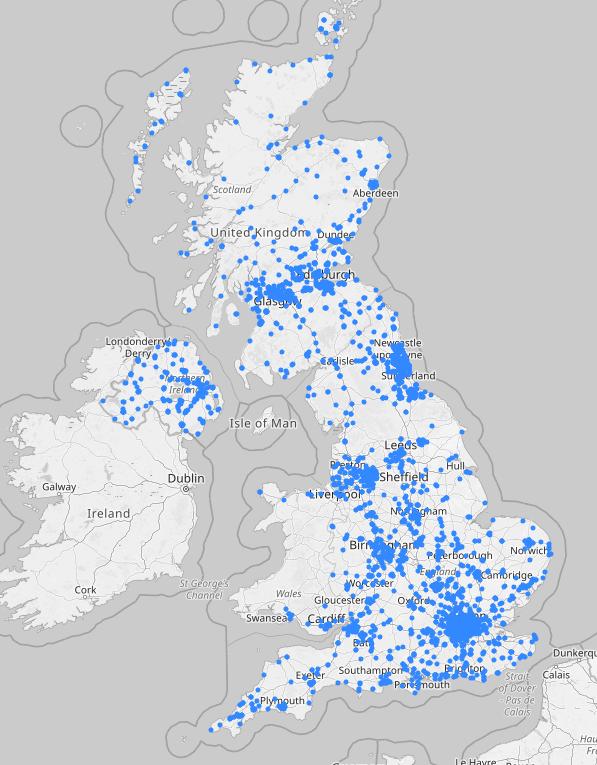
We actually want our circles to be larger so that they're easier to click on so increase the radius to 8:
    marker.setStyle({
      radius: 8
    });
Now let's set the colour of the marker using the colorScale object we added earlier. First add a variable color that stores the colour of the current marker:
    ...
    var marker = L.circleMarker([+d.latitude, +d.longitude]);
    var color = colorScale[d.deviceControllerName] || '#aaa';
    ...
Notice
colorfallbacks to#aaaifcolorScaledoesn't contain the controller we're looking for
Use the variable color to set the fillColor:
    var color = colorScale[d.deviceControllerName] || '#aaa';

    marker.setStyle({
      radius: 8,
      fillColor: color
    });
Hmmm... the markers don't look great do they?!
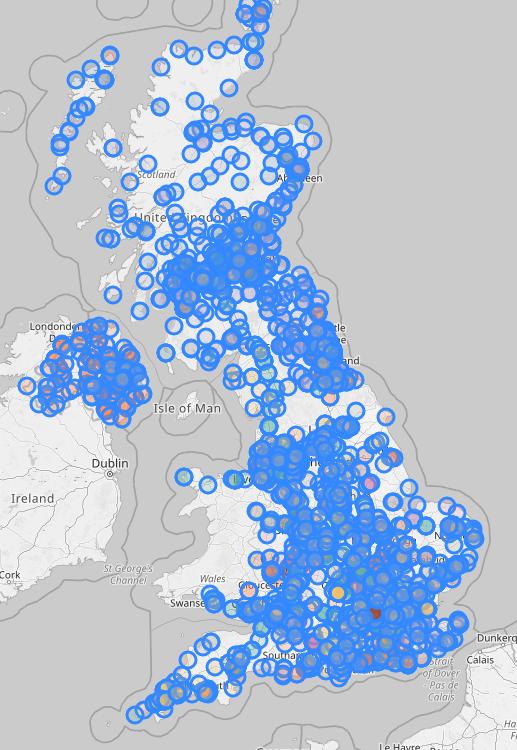
The markers still have a thick blue outline (this is the default) and the default fill opacity is 0.2. Let's change these:
    marker.setStyle({
      radius: 8,
      fillOpacity: 1,
      fillColor: color,
      color: '#ddd',
      weight: 0.25
    });
fillOpacitysets the opacity of the circle,colorsets the colour of the circle's outline andweightsets the thickness of the circle's outline
The markers look much better now:
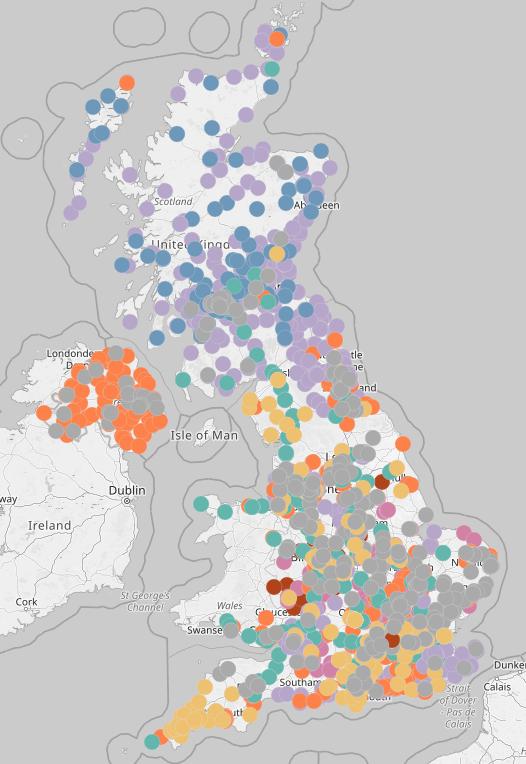
Now add a variable inService that determines whether the current charging point is in service:
    ...
    var marker = L.circleMarker([+d.latitude, +d.longitude]);
    var inService = d.chargeDeviceStatus === 'In service';
    var color = colorScale[d.deviceControllerName] || '#aaa';
    ...
and wrap the styling code in an if statement so that only the 'In service' markers are styled:
if (inService) {
marker.setStyle({
radius: 8,
fillColor: color,
fillOpacity: 1,
color: '#ddd',
weight: 0.25
});
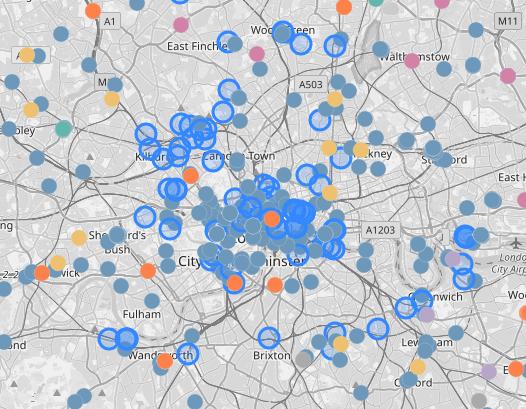
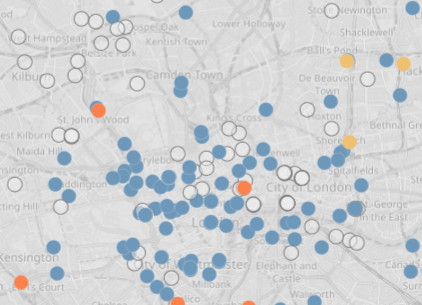
}Now the 'In service' markers are coloured and the 'Out of service' ones revert to the default styling. Here's how London looks:
Style the 'Out of service' charging points
We'll style the 'out of service' charging points in a similar manner. First add an else block:
    if (inService) {
      ...
    } else {
    }
and add an empty .setStyle call:
    if (inService) {
      ...
    } else {
      marker.setStyle({
      });
    }
If a charging point is 'out of service' we'll colour the circle light grey, make it semi-transparent, make its stroke medium grey and it stroke a bit thicker:
if (inService) {
...
} else {
marker.setStyle({
radius: 8,
fillColor: '#eee',
fillOpacity: 0.5,
color: '#777',
weight: 1
});
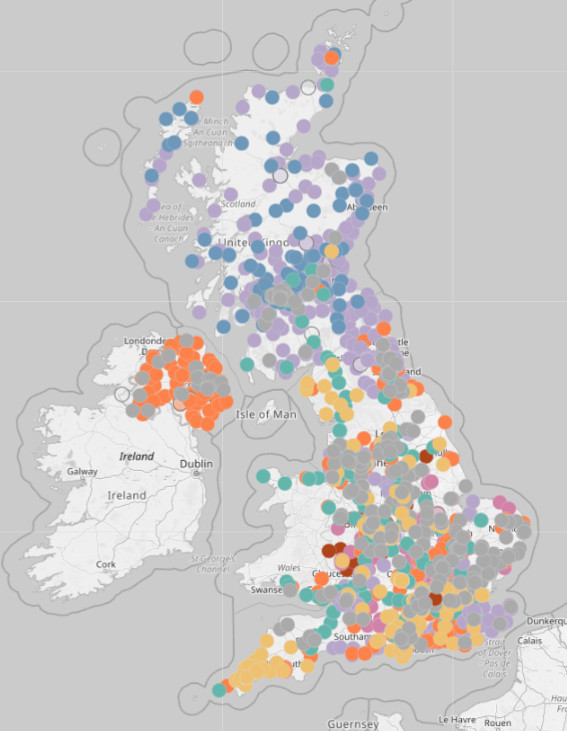
}Now the map should look like:
Adjust basemap opacity
Finally we'll make the basemap a bit lighter to help the circles stand out.
In the CSS panel add an opacity rule to the map's filter:
.leaflet-container .leaflet-tile-pane img {
  filter: grayscale(1)opacity(0.3);
}
This is a subtle change so you'll need to look carefully to see the difference! Hopefully you'll agree it helps the circles stand out.
Before lightening the basemap:
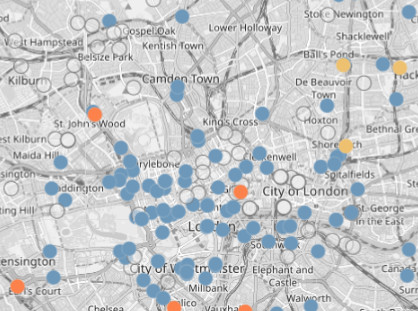
And after:
The code
See the Pen UK charging points map (Step 3) by Peter Cook (@createwithdata) on CodePen.
Wrapping up
In this part you styled the charging points in a data-driven manner. The colour of each 'in service' charging point was set according to its controller and 'out of service' points were set to a semi-transparent grey.
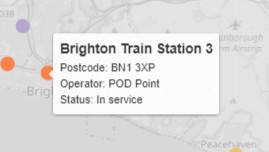
In the next part you'll add a pop-up which shows information on a hovered charging point:
a legend showing the colour of each controller:
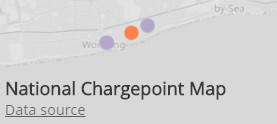
and a title and link to the data:
Hope to see you in the next part!

AI for Data Visualisation shows you how AI can help you explore, transform and visualise your data.
Find out more
Visualising Data with JavaScript teaches you how to build charts and data stories using Chart.js, Leaflet, D3 and React.
Find out more
Data Dashboards with JavaScript teaches you how to build data dashboards using React, Chart.js and Leaflet.
Find out more
Learn the fundamentals of HTML, SVG, CSS and JavaScript for building data visualisations on the web.
Find out more
"One of the best D3 books I've read. The contents are very clear, it is easy to follow and the concepts are very solid."
D3 Start to Finish teaches you how to build a custom, interactive and beautiful data visualisation using the JavaScript library D3.js.
Find out more