How to make a data-driven map: Part Two
Requires completion of Part One and basic knowledge of JavaScript, HTML and CSS
25 July 2019
This is Part Two of a four part tutorial on how to make a data-driven map using JavaScript.
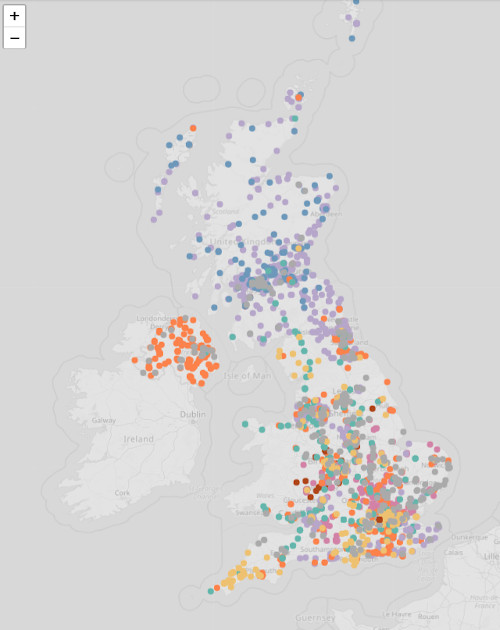
The end result is an web map visualising electric vehicle chargepoint locations:
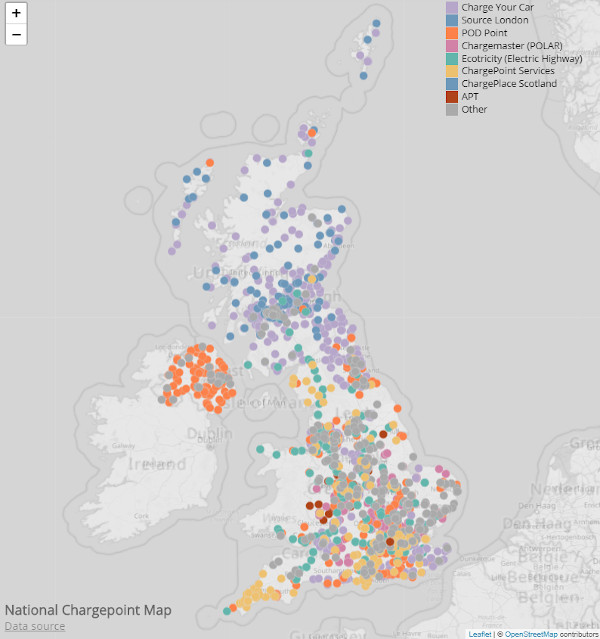
In this part we'll load a dataset from the UK's National Chargepoint Registry using D3 and will display each location on the map:
Outline
The steps you'll take are:
- include D3 n your project
- load the data using D3
- plot the locations on the map
Include D3.js
Open your work from Part One (or use Part One's pen).
Include D3 by clicking on the cog in the JS panel:
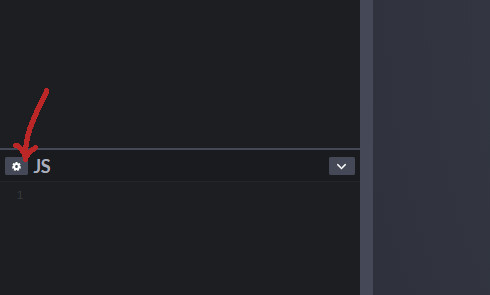
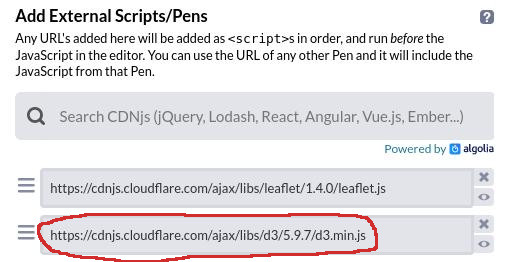
and add https://cdnjs.cloudflare.com/ajax/libs/d3/5.9.7/d3.min.js to the 'Add External Scripts/Pens' list:
If you wish to save your work you can click the 'Fork' button.
Load the CSV data
You'll now use D3's .csv() function to load the CSV file into your app. This function will request the CSV file and transform it into an array of objects.
Add the following code to the bottom of the JS panel:
d3.csv('https://s3-us-west-2.amazonaws.com/s.cdpn.io/2814973/charge-points-slim.csv')
  .then(function(csv) {
    // csv is an array of objects where each object represents a charging point
});
The above code requests a CSV file named charge-points-slim.csv that's hosted using CodePen's asset hosting. (The CSV file is derived from the original charging points dataset. I've removed several columns to reduce the file size.)
If you wish to load your own data you'll need to host it somewhere (e.g. CodePen's asset hosting, Google Cloud Storage etc.) and replace the URL in the
d3.csv()call. Be careful with CORS restrictions.
When D3 receives the data it converts it into an array of objects and the callback function (function(csv) {...}) is invoked. The parameter csv is an array of objects that'll look something like:
[
  {
    "name": "2 Riddons Road",
    "latitude": "51.431454",
    "longitude": "0.031175",
    "postcode": "SE12 9QR",
    "chargeDeviceStatus": "In service",
    "deviceControllerName": "Source London"
  },
  {
    "name": "9 Bath Road Car Park",
    "latitude": "51.48092",
    "longitude": "-0.419318",
    "postcode": "TW6 2AA ",
    "chargeDeviceStatus": "Out of service",
    "deviceControllerName": "Source London"
  },
  {
    "name": "ACE Cafe London",
    "latitude": "51.54121",
    "longitude": "-0.277943",
    "postcode": "NW10 7UD",
    "chargeDeviceStatus": "In service",
    "deviceControllerName": "Source London"
  },
  {
    "name": "Acton Street",
    "latitude": "51.52834",
    "longitude": "-0.118619",
    "postcode": "WC1X 9LZ",
    "chargeDeviceStatus": "Out of service",
    "deviceControllerName": "Source London"
  },
  ...
Notice that each row of the CSV file has been transformed into an object. Each object has a number of properties which correspond to columns of the CSV file.
In the next step we'll iterate through the array and add markers to the map.
Add markers
Start by declaring a global variable data at the top of the JavaScript:
var data;In the callback function assign csv to data (so that we can access the data anywhere in the code):
d3.csv('https://s3-us-west-2.amazonaws.com/s.cdpn.io/2814973/charge-points-slim.csv')
  .then(function(csv) {
    data = csv;
});
Global variables are fine in small examples such as this. Try to avoid using them in larger projects.
Near the top of the file, just after var data; add a function addMarkers() that iterates through data and adds a marker to the map:
function addMarkers() {
  data.forEach(function(d) {
    var marker = L.circleMarker([+d.latitude, +d.longitude]);
    marker.addTo(map);
  })
}
We're using Leaflet's circleMarker which draws a circle at a given latitude and longitude.
A
circleMarkeris added by callingL.circleMarker([lat, lon])wherelatandlonare latitude and longitude values. When D3 converts the CSV into an array of objects, the latitude and longitude are strings so we convert them to numbers using the+operator.
Now call addMarkers() in the request callback:
d3.csv('https://s3-us-west-2.amazonaws.com/s.cdpn.io/2814973/charge-points-slim.csv')
.then(function(csv) {
data = csv;
addMarkers();
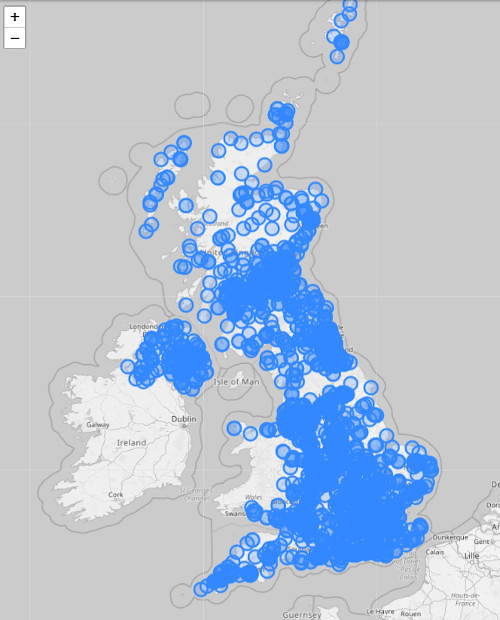
});You should now be seeing a map overlaid with lots of blue circles:
The code
See the Pen UK charging points map (Step 2) by Peter Cook (@createwithdata) on CodePen.
Wrapping up
In this part you loaded a CSV file of charging points into your application and plotted the points on the map.
D3 was able to do a lot of the work for us, in particular making the request and converting the CSV file into an array of objects. We were then able to draw a marker for each charging point using Leaflet's circleMarker.
In the next part we'll style the markers in a data-driven fashion. They'll be colour coded according to the operator name (using the deviceControllerName property) and their status (using the chargeDeviceStatus property).
Happy mapping and I hope to see you in the next part!
AI for Data Visualisation shows you how AI can help you explore, transform and visualise your data.
Find out more
Visualising Data with JavaScript teaches you how to build charts and data stories using Chart.js, Leaflet, D3 and React.
Find out more
Data Dashboards with JavaScript teaches you how to build data dashboards using React, Chart.js and Leaflet.
Find out more
Learn the fundamentals of HTML, SVG, CSS and JavaScript for building data visualisations on the web.
Find out more
"One of the best D3 books I've read. The contents are very clear, it is easy to follow and the concepts are very solid."
D3 Start to Finish teaches you how to build a custom, interactive and beautiful data visualisation using the JavaScript library D3.js.
Find out more