Create a rotating globe using React and D3
Requires moderate experience with React
01 August 2018
This tutorial shows how to create a rotating globe using React and D3. We'll use React to create a component which'll contain the rotating globe and D3's powerful geographic functionality to deal with transforming our geographic data into SVG.
See the Pen React / D3 rotating globe by Frontend Charts (@frontendcharts) on CodePen.
1. Create project
There's several different ways to create a React based project so either use your usual approach and adapt this tutorial to your particular needs, or follow along on Codepen.
The main thing to make sure is that the two React libraries react and react-dom together with D3 and topojson are included. For example if using Codepen, include these files:
https://npmcdn.com/react@15.2.1/dist/react.min.js
https://npmcdn.com/react-dom@15.2.1/dist/react-dom.min.js

https://cdnjs.cloudflare.com/ajax/libs/d3/4.2.2/d3.min.js
https://cdnjs.cloudflare.com/ajax/libs/topojson/3.0.0/topojson.min.js
2. Create Globe component
Our project will consist of a single React component Globe. This will contain an SVG element and a path element (for the countries):
class Globe extends React.Component {
  render() {
    return <svg width={this.props.size} height={this.props.size} >
      <path d="" />
    </svg>
  }
}
The d attribute in the path element will eventually be a string consisting of a series of draw commands (such as move to, draw a line etc.). In this tutorial we don't need to know the precise details of these commands as D3 will take care of this for us.
Let's also render this component:
ReactDOM.render(
  <Globe size={400} />,
  document.getElementById('app')
)
(Make sure you have a div element with id app in your HTML!)
3. Load and process geographic data
Two of the most common ways of representing geographic data on the web are GeoJSON and TopoJSON. GeoJSON is a JSON based format for describing geographic features while TopoJSON is also JSON based but it cleverly reduces size by removing redundancy/repetition in the geographic data.
We've a world TopoJSON file which we'll use in this project. Let's:
- load it using D3
- convert it to GeoJSON (we need to convert it to GeoJSON as that's the format D3 prefers) &
- pass it into our
Globecomponent:
d3.json('https://codepen.io/frontendcharts/pen/JBprpp.js', (err, json) => {
  let geoJson = topojson.feature(json, json.objects.ne_110m_admin_0_countries)

  ReactDOM.render(
    <Globe geoJson={geoJson} size={400} />,
    document.getElementById('app')
  )
})
4. Render the globe
The GeoJSON file contains an array of features, each of which is described by arrays of longitude and latitude co-ordinates. Each co-ordinate represents a location on the surface of the earth. Converting these to x and y positions on the screen is known as projection and is something D3 can do for us (saving us some mathematical headaches!).
The first step in setting up a projection in D3 is to choose the type of projection we'd like. We'll use an orthographic projection as this'll make the earth look like a globe. Let's create the D3 projection function at the start of our render() function:
render() {
  let projection = d3.geoOrthographic()
    .fitSize([this.props.size, this.props.size], this.props.geoJson)

  ...
}
Note that we use fitSize to automatically scale the projection to size. For more in depth information about D3's geographic functionality see D3 in Depth.
We'll now use D3's geoPath function to create a function geoGenerator that converts our GeoJSON into a path string:
render() {
  ...
  let geoGenerator = d3.geoPath()
    .projection(projection)

  let pathString = geoGenerator(this.props.geoJson)
  ...
}
We can now pass pathString into our SVG path:
render() {
  ...
  return <svg width={this.props.size} height={this.props.size} >
    <path d={pathString} />
  </svg>
}
See the finished code on Codepen.
When we run this code we should now see a globe:
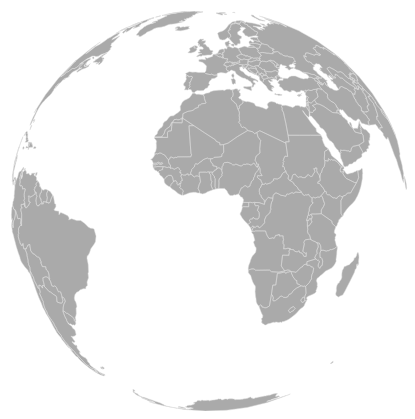
5. Spin the globe
Finally let's start the globe rotating. D3's projection has a rotate option which specifies the rotation (in degrees) of the projection.
First we'll add a rotation property to Globe's state:
class Globe extends React.Component {
  constructor(props) {
    super(props)

    this.state = {
      rotation: 0
    }
  }

  ...
}
and then we'll set the projection's rotation:
render() {
  let projection = d3.geoOrthographic()
    .fitSize([this.props.size, this.props.size], this.props.geoJson)
    .rotate([this.state.rotation])

  ...
}
Finally we set up a requestAnimationFrame callback function that'll increment rotation:
render() {
  ...
  window.requestAnimationFrame(() => {
    this.setState({
      rotation: this.state.rotation + 0.2
    })
  })
  ...
}
Now when we run the app the globe will slowly spin round!
6. Summary
This tutorial has shown how we can use React and D3 to create a rotating globe. React allows us to build a reusable component that handles the creation and updating of our SVG while D3 provides the geographic cleverness.
Have a play around with the code on Codepen - see if you can change things like the size of the globe abd the speed of rotation. If you're feeling more adventurous you could explore some of the other projections that D3 provides. There's quite a few to choose from!
Code
See the Pen React / D3 rotating globe by Frontend Charts (@frontendcharts) on CodePen.
AI for Data Visualisation shows you how AI can help you explore, transform and visualise your data.
Find out more
Visualising Data with JavaScript teaches you how to build charts and data stories using Chart.js, Leaflet, D3 and React.
Find out more
Data Dashboards with JavaScript teaches you how to build data dashboards using React, Chart.js and Leaflet.
Find out more
Learn the fundamentals of HTML, SVG, CSS and JavaScript for building data visualisations on the web.
Find out more
"One of the best D3 books I've read. The contents are very clear, it is easy to follow and the concepts are very solid."
D3 Start to Finish teaches you how to build a custom, interactive and beautiful data visualisation using the JavaScript library D3.js.
Find out more