Visualising CSV data with Chart.js
Requires intermediate knowledge of JavaScript
21 January 2019
In this tutorial I show you how to load a comma separated value (CSV) file and visualise it using Chart.js.

Click image to view interactive chart
Background
A CSV file is a text file that represents a table of data. Think of it as a text-based representation of a spreadsheet. Each line represents a row in the spreadsheet and each value is separated by a comma:
Name,Weeks,Gender
Steffi Graf,377,Female
Martina Navratilova,332,Female
Serena Williams,319,Female
Roger Federer,308,Male
etc.
The CSV data we'll use is a list of tennis players containing the number of weeks they've spent at the top of the ATP (for men) and WTP (for women) rankings. The original dataset is from Tableau.
You'll use D3 to load the CSV file and Chart.js to make the chart.
Getting started
You'll use CodePen to make the chart because it's easy to use and requires minimal set-up. If you prefer to develop locally you can export the project files from the pen. (You'll also need to set up local webserver.)
In CodePen create a new pen then click on the cog in the JS panel.
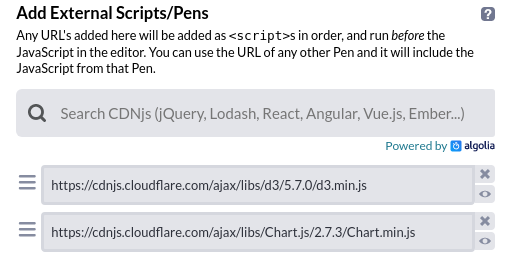
Add Chart.js and D3 by adding the following URLs to the 'Add External Scripts/Pens' list:
- https://cdnjs.cloudflare.com/ajax/libs/Chart.js/2.8.0/Chart.min.js
- https://cdnjs.cloudflare.com/ajax/libs/d3/5.7.0/d3.min.js
Make a simple chart
You'll start by creating a simple bar chart using Chart.js.
Add a <canvas> element to the HTML:
<canvas id="chart"></canvas>This will act as a container for the chart.
Now add the following JavaScript (to CodePen's JS panel):
var chart = new Chart('chart', {
type: 'horizontalBar',
data: {
labels: ['A', 'B', 'C'],
datasets: [
{
data: [10, 20, 30]
}
]
}
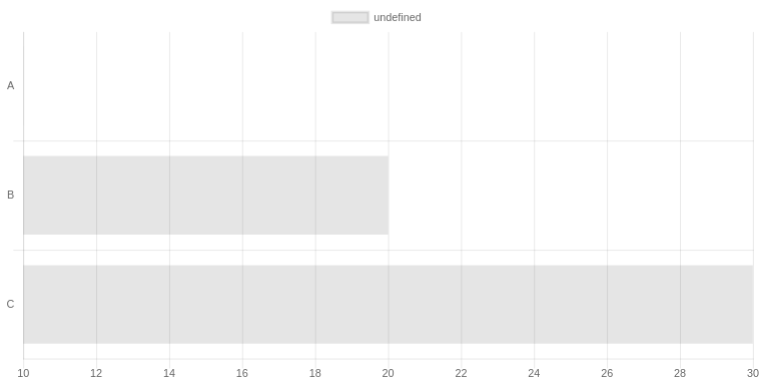
});This uses Chart.js to create a horizontal bar chart.
In CodePen's output panel you should see something like:
Load the csv file
You'll use D3's .csv() function to request the CSV file. (The CSV file is hosted at https://s3-us-west-2.amazonaws.com/s.cdpn.io/2814973/atp_wta.csv).
Add the following to the top of the JavaScript:
d3.csv('https://s3-us-west-2.amazonaws.com/s.cdpn.io/2814973/atp_wta.csv')
  .then(makeChart);

function makeChart(players) {
  // players is an array of objects where each object represents a player
}
This does two things:
- requests the CSV file
- when the CSV arrives, converts it into an array and calls the function
makeChart()
The array will consist of objects, where each object represents a row in the CSV:
[
  {
    "Name": "Steffi Graf",
    "Weeks": "377",
    "Gender": "Female"
  },
  {
    "Name": "Martina Navratilova",
    "Weeks": "332",
    "Gender": "Female"
  },
  {
    "Name": "Serena Williams",
    "Weeks": "319",
    "Gender": "Female"
  },
  {
    "Name": "Roger Federer",
    "Weeks": "308",
    "Gender": "Male"
  },
  ...
]
The function makeChart() is called after the array has been created and the array is passed in as the first parameter.
Add the CSV data to the chart
Move the chart code into makeChart(). Your JavaScript is now:
d3.csv('https://s3-us-west-2.amazonaws.com/s.cdpn.io/2814973/atp_wta.csv')
  .then(makeChart);

function makeChart(players) {
  var chart = new Chart('chart', {
    type: 'horizontalBar',
    data: {
      labels: ['A', 'B', 'C'],
      datasets: [
        {
          data: [10, 20, 30]
        }
      ]
    }
  });
}
Note that makeChart's first parameter is named players. This is the array of players.
Add the player names to the chart
The y-axis labels are set using the labels array (which is currently ['A', 'B', 'C']).
We'd like this to be an array of the player names. We can create this using JavaScript's .map() function.
Add the following to the beginning of makeChart():
var playerLabels = players.map(function(d) {return d.Name});The map() function goes through each item of players and picks out the Name property. Thus playerLabels is an array like:
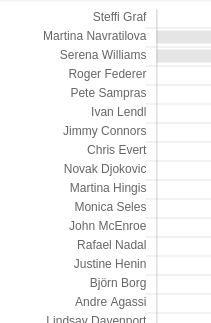
['Steffi Graf', 'Martina Navratilova', 'Serena Williams', ...]Update labels value to playerLabels:
var chart = new Chart('chart', {
  type: 'horizontalBar',
  data: {
    labels: playerLabels,
    ...
  }
});
You should now see the player names along the y-axis:
Add the weeks to the chart
The length of the bars are determined by the data array (which is currently [10, 20, 30]).
In a similar manner to the labels you'll create an array of 'weeks at number one' using .map():
var weeksData = players.map(function(d) {return d.Weeks});Now update data's value to weeksData:
...
datasets: [
{
data: weeksData
}
]
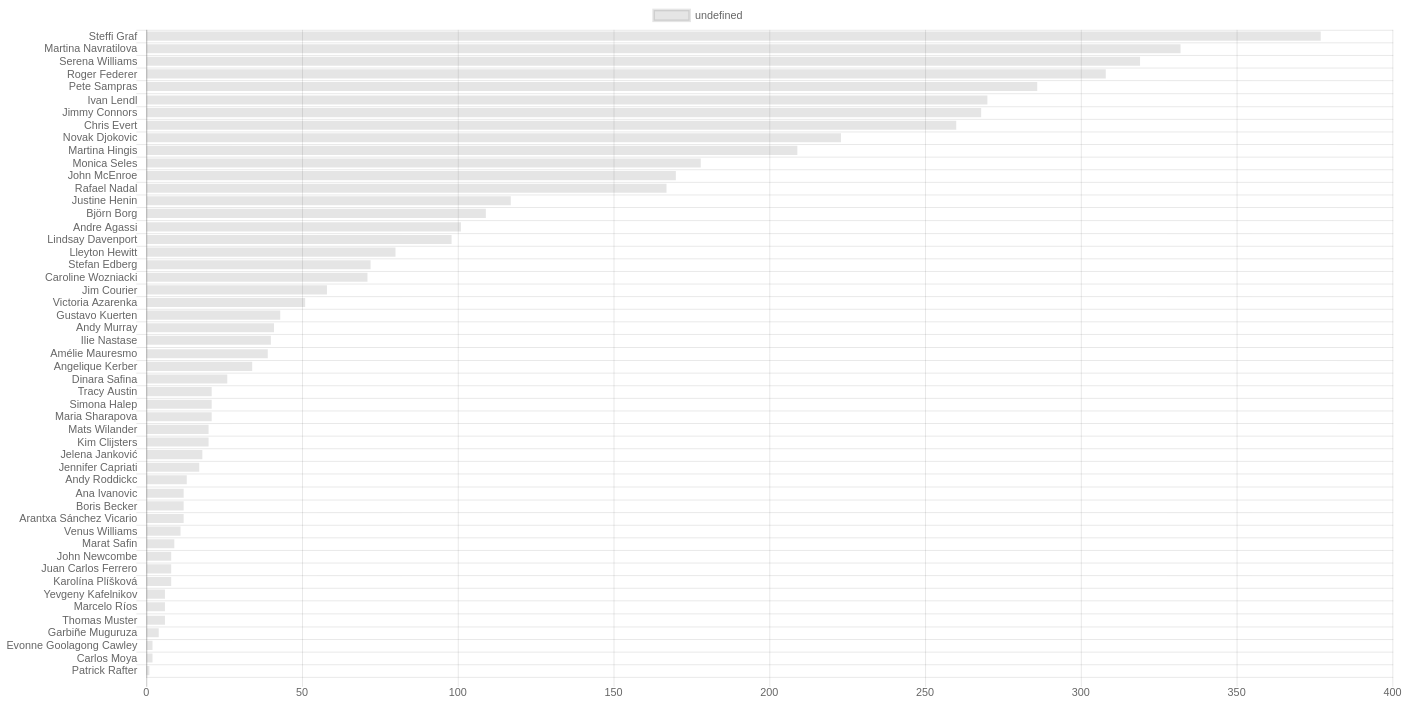
...makeChart() should now look like:
function makeChart(players) {
  var playerLabels = players.map(function(d) {return d.Name});
  var weeksData = players.map(function(d) {return d.Weeks});

  var chart = new Chart('chart', {
    type: 'horizontalBar',
    data: {
      labels: playerLabels,
      datasets: [
        {
          data: weeksData
        }
      ]
    }
  });
}
Now you should be seeing a bar chart of the CSV data:
Loading your own data
You might like to load your own data into a Chart.js chart. If you know your way around a local webserver you can host the file locally and update the URL in the d3.csv() call.
Otherwise you could host your CSV on CodePen and use its URL in the d3.csv() call.
Summary
We loaded a CSV file into the browser using D3's .csv() function. This converts the CSV into an array of objects where each object represents a single player.
We then used JavaScript's .map() function to convert the array of objects into an array of player names and an array of weeks. We created a bar chart using Chart.js and used these two arrays to set the player labels and bar lengths.
The code
See the Pen Visualising a CSV file with Chart.js (basic) by Peter Cook (@createwithdata) on CodePen.
Here's another version with additional styling:
See the Pen Visualising a CSV file with Chart.js by Peter Cook (@createwithdata) on CodePen.
AI for Data Visualisation shows you how AI can help you explore, transform and visualise your data.
Find out more
Visualising Data with JavaScript teaches you how to build charts and data stories using Chart.js, Leaflet, D3 and React.
Find out more
Data Dashboards with JavaScript teaches you how to build data dashboards using React, Chart.js and Leaflet.
Find out more
Learn the fundamentals of HTML, SVG, CSS and JavaScript for building data visualisations on the web.
Find out more
"One of the best D3 books I've read. The contents are very clear, it is easy to follow and the concepts are very solid."
D3 Start to Finish teaches you how to build a custom, interactive and beautiful data visualisation using the JavaScript library D3.js.
Find out more